Difference between revisions of "Selection"
(→What is Model Selection?) |
(→What is Model Selection?) |
||
| Line 11: | Line 11: | ||
Clearly, in the second case, it would be more appropriate to fit a parabola to the data, rather than a line. How would we do that? | Clearly, in the second case, it would be more appropriate to fit a parabola to the data, rather than a line. How would we do that? | ||
| − | A parabola is described by the formula: <big> <math> y = a x^2 + m x + b. </math> </big> This is a line with a new term, <big> <math> a x^2 | + | A parabola is described by the formula: <big> <math> y = a x^2 + m x + b. </math> </big> This is a line with a new term, <big> <math> a x^2, </math> </big> added. To fit a parabola the procedure is almost the same. First determine the errors in the data: |
<big> <math> Error(x,y,a,m,b) = a x^2 + m x + b - y </math> </big> | <big> <math> Error(x,y,a,m,b) = a x^2 + m x + b - y </math> </big> | ||
| Line 22: | Line 22: | ||
<big> <math> Cost(a,m,b) = \sum_{data} Penalty(x,y,a,m,b) </math> </big> | <big> <math> Cost(a,m,b) = \sum_{data} Penalty(x,y,a,m,b) </math> </big> | ||
| + | |||
| + | Now we tweak the three parameters (a,m,b) using, for example the Nelder-Meade method we studied last week. Of course MATLAB has its own routines for solving this problem based on Linear Algebra that are much better than Nelder-Meade. | ||
Revision as of 16:28, 22 April 2009
First, the homework from Lab W.
What is Model Selection?
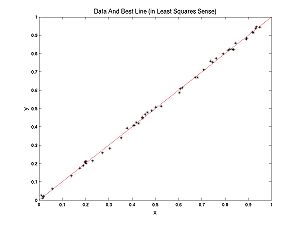
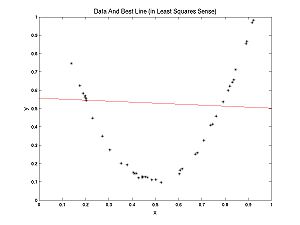
What is model selection? To answer this question let's contrast model selection with parameter estimation. In the Optimization Lab, we fit lines to data. We were doing parameter estimation, trying to estimate the parameters m and b, in the formula for a line y = m*x + b. Recall my examples: we fit a line to nearly linear data and another line to nearly parabolic data.
Clearly, in the second case, it would be more appropriate to fit a parabola to the data, rather than a line. How would we do that?
A parabola is described by the formula:  This is a line with a new term,
  added. To fit a parabola the procedure is almost the same. First determine the errors in the data:

Now define the penalties, (let's be sensible and use LS rather the UG penalties):

And finally the cost function

Now we tweak the three parameters (a,m,b) using, for example the Nelder-Meade method we studied last week. Of course MATLAB has its own routines for solving this problem based on Linear Algebra that are much better than Nelder-Meade.

